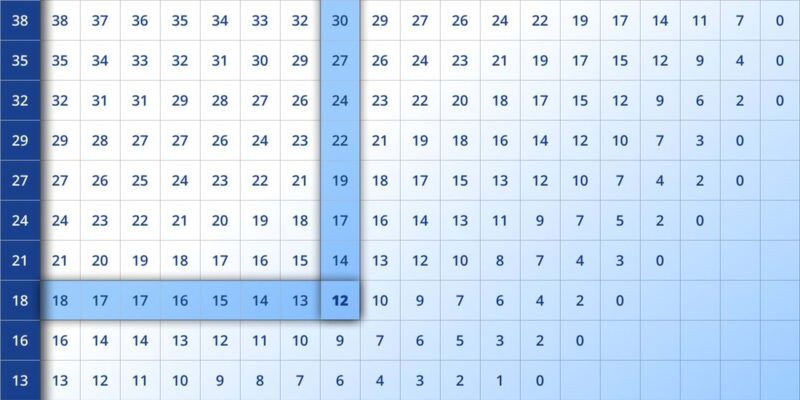
Understanding weather patterns and atmospheric conditions is vital for various fields, from agriculture to aviation, and even for everyday activities like planning outdoor events. Among the many tools used to interpret weather, the dew point chart stands out as an essential yet often misunderstood resource. This guide breaks down the concept of the dew point chart, its significance, and how to use it effectively.
What is the Dew Point?
Before delving into the chart, it is crucial to understand what the dew point represents. The dew point is the temperature at which air becomes saturated with moisture and water vapor condenses into dew. This phenomenon occurs when the air cannot hold any more moisture at its current pressure and temperature.
The dew point is a direct indicator of humidity levels. A higher dew point signifies more moisture in the air, resulting in a muggy or sticky feeling. Conversely, a lower dew point reflects drier air.
Why is the Dew Point Important?
The dew point is more than just a number; it impacts:
Comfort Levels:
-
Dew points above 60°F (15.5°C) often feel uncomfortable, especially when combined with high temperatures.
-
Dew points below 50°F (10°C) tend to indicate dry and pleasant conditions.
Weather Forecasting:
-
Dew point readings help meteorologists predict fog, frost, and precipitation.
Industrial Applications:
-
Industries like food storage and chemical production rely on dew point monitoring to prevent moisture-related damage.
Understanding the Dew Point Chart
The dew point chart is a graphical representation that correlates temperature, relative humidity, and dew point. It typically displays:
-
Temperature (x-axis): Measured in degrees Celsius or Fahrenheit.
-
Relative Humidity (curved lines): Expressed as a percentage.
-
Dew Point (y-axis): The resulting value based on the given temperature and relative humidity.
By locating the intersection of a specific temperature and humidity level on the chart, you can determine the corresponding dew point.
How to Read a Dew Point Chart
Reading a dew point chart might seem daunting at first, but it becomes straightforward with practice. Here’s a step-by-step guide:
Identify the Temperature:
-
Locate the current air temperature on the x-axis.
Find the Relative Humidity:
-
Follow the curved line corresponding to the observed humidity level.
Locate the Intersection:
-
The point where the temperature line intersects the humidity curve gives the dew point value on the y-axis.
For example, if the temperature is 85°F (29.4°C) and the relative humidity is 70%, the intersection on the chart will indicate a dew point of approximately 74°F (23.3°C).
Applications of Dew Point Charts
Dew point charts are indispensable in various domains:
Meteorology
Meteorologists use dew point data to:
-
Predict fog formation: Fog occurs when the dew point and air temperature converge.
-
Forecast precipitation: A higher dew point often indicates the potential for rain or storms.
-
Determine heat index: The combination of temperature and dew point affects perceived heat levels.
Agriculture
Farmers rely on dew point readings to:
-
Plan irrigation schedules.
-
Protect crops from frost damage by monitoring low dew points.
-
Optimize storage conditions for harvested produce.
Aviation
Pilots and aviation specialists consider the dew point to:
-
Assess visibility conditions.
-
Identify risks of icing or frost on aircraft.
-
Monitor runway conditions in humid environments.
Daily Life
Individuals can use dew point information to:
-
Plan outdoor activities: High dew points may signal uncomfortable or stormy weather.
-
Adjust indoor air conditioning settings for optimal comfort.
-
Select appropriate clothing based on expected humidity levels.
Dew Point vs. Relative Humidity
While closely related, the dew point and relative humidity are not the same. Relative humidity measures how much moisture the air holds relative to the maximum it can hold at a specific temperature. Dew point, however, provides an absolute measure of moisture content in the air.
For instance, a relative humidity of 50% at 40°F (4.4°C) feels much drier than the same relative humidity at 85°F (29.4°C). This difference arises because warmer air can hold more moisture, making the dew point a more reliable indicator of actual humidity.
Common Misconceptions About Dew Point
Higher Dew Point Always Means Rain:
-
While a high dew point indicates moisture, it does not guarantee precipitation unless other atmospheric conditions are favorable.
Dew Point Equals Air Temperature:
-
This is only true at 100% relative humidity, a condition often associated with fog or dew.
Comfort Levels Depend Solely on Temperature:
-
In reality, the combination of temperature and dew point determines how “comfortable” the air feels.
Tips for Using Dew Point Charts Effectively
-
Practice: Familiarize yourself with the chart by working through sample scenarios.
-
Use Digital Tools: Modern apps and weather stations often provide real-time dew point calculations based on temperature and humidity readings.
-
Combine Data Sources: For a comprehensive understanding, consider other weather parameters like wind speed and atmospheric pressure.
Conclusion
The dew point chart is a powerful tool for interpreting weather conditions, offering insights into humidity levels, potential precipitation, and comfort levels. Whether you’re a meteorologist, farmer, aviator, or simply someone planning a day outdoors, understanding how to read and apply dew point data can make a significant difference.
By mastering this chart, you’ll gain a clearer perspective on the interplay of temperature, humidity, and moisture, empowering you to make informed decisions in various aspects of life.
