
Market Analysis
Engaging forex and crypto signals with vibrant animations.
BTC
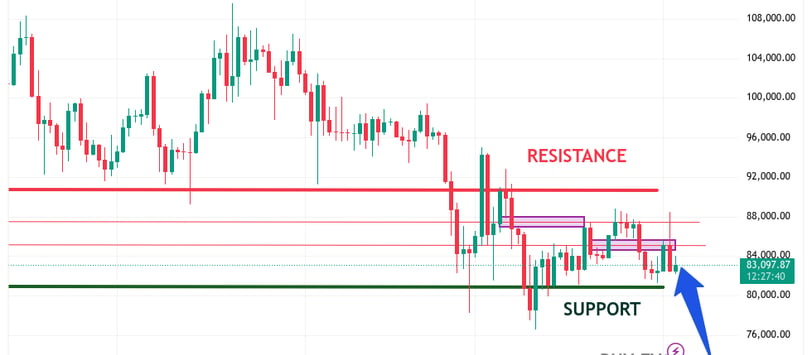
BTCUSDT (1D - BUY Opportunity & Scalp SELL Zone)
Validity: 04 PM - 05 PM (04 April)
Sell FVG (Fair Value Gap) Zones:
Sell Zone 1 (FVG) 87,967 to 86,877
Important Zone 87,212
Buy FVG (Fair Value Gap) Zones:
Buy Zone 1 (FVG) 84,613 to 85,536
Important Zone 85,116
Support Levels:
First Support 80,757
Second Support 82,517
Resistance Levels:
First Resistance 88,805
Second Resistance 90,649
Market Strategy for BTC
Sell FVG:
Zone 1 (87,967 to 86,877):
If BTC price enters this range, expect potential resistance, particularly around the Important Zone of 87,212. This could present a short opportunity if price action indicates rejection or reversal at this level.
Buy FVG:
Zone 1 (84,613 to 85,536):
If BTC price drops into this range, look for potential support and reversal around 85,116 (Important Zone). This could offer a buying opportunity if the market shows signs of a bullish reversal at this level.
Support and Resistance Levels:
Support Levels:
First Support 80,757
If the price moves lower, 80,757 is a key level to monitor for potential bounce or reversal. If the market finds support here, it could lead to a bounce or range-bound behavior.
Second Support 82,517
If the price continues to dip below 80,757, then 82,517 is the next level to watch for potential support.
Resistance Levels:
First Resistance 88,805
This level is crucial for any bullish move. If the price tests this resistance level and fails to break through, expect potential rejection or consolidation.
Second Resistance 90,649
Should price breach 88,805, the next target will be 90,649, which would indicate strong bullish momentum if broken.
Price Action Watchlist for BTC:
Key Sell Zone: Look for bearish setups around 87,212 (sell opportunity).
Key Buy Zone: Watch for bullish reversals near 85,116 (buy opportunity).
Support Watch: If the price reaches 80,757 or 82,517, look for signs of reversal or range-bound behavior.
Resistance Watch: If the price tests 88,805 or 90,649, be cautious of rejection or potential breakout.
Additional Considerations:
Tariff or major economic policy changes can create high volatility, affecting both buy and sell zones. If these zones are tested during such periods, the price may move more sharply.
As you mentioned, 84,110 could be a pivotal level. If the price approaches this, closely watch how the market reacts. It may indicate a major shift or consolidation.
Example Trade Scenarios:
Bearish Setup:
Price reaches 87,212, showing a reversal or rejection. Enter a short position targeting the next support levels (82,517, 80,757).
Bullish Setup:
Price drops into the buy zone between 84,613 and 85,116. If price shows signs of support and reversal, enter a long position targeting resistance at 88,805 or 90,649.
Summary Table:
Action Zone :: Important Level :: Potential Outcome
Sell FVG 87,967 to 86,877 87,212 Bearish setup if rejection occurs
Buy FVG 84,613 to 85,536 85,116 Bullish setup if support holds
Support 1 80,757 - Potential bounce or range-bound
Support 2 82,517 - Secondary level for support
Resistance 1 88,805 - Watch for potential rejection
Resistance 2 90,649 - Watch for breakout
XAUUSD
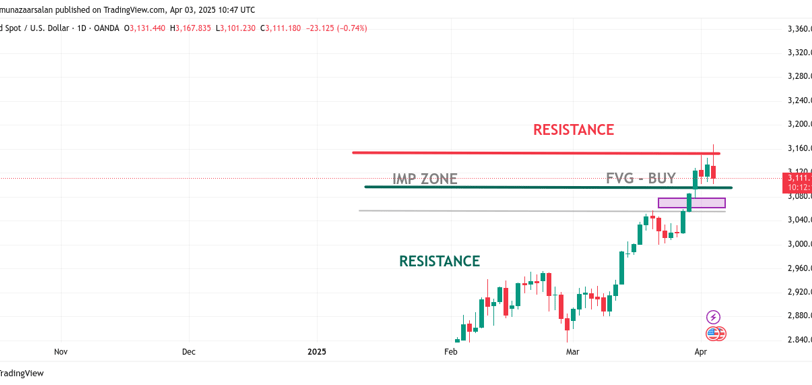
XAUUSD (1D - BUY Opportunity & Scalp SELL Zone)
Current Market Overview:
The current market for XAUUSD (Gold against the US Dollar) is showing potential for a BUY opportunity based on specific support, resistance, and key levels of interest (Important Zones). The price action is constrained within certain levels, and the market is likely to test these boundaries, making it a key moment for trading.
Key Price Levels:
Support Level: 3056.885
This is a key level of support where buying interest might emerge if the price approaches this level.
Resistance Level: 3067.350
A significant resistance level to watch for potential breakout or reversal. If the price breaks above this, it could signify further bullish momentum.
Important Zone (Imp Zone): 3096.384
This is a critical level to watch. If the price breaches this zone, it is likely to trigger a significant bullish move.
If the price breaks 3096.384, we can expect further upward movement towards higher levels, making it a trigger for BUY.
BUY Setup:
Entry Range: 3083 - 3089
The entry range represents the price zone where the market may offer a good risk-to-reward setup for buying. It aligns with a possible bullish breakout scenario, especially if the price holds above 3067.350.
Stop Loss: 3072
Set the stop loss below the support level in the entry range, ensuring that you are protected in case of any false breakout or reversal. The price should hold above 3072 for the bullish case to remain valid.
Target:
A potential upside target for this buy setup is likely to be at the Important Zone (Imp Zone) around 3096.384 or higher, depending on market momentum.
SELL Scalp Opportunity:
Imp Zone for SELL Scalp: 3049.493 - 3057.273
This is the critical zone to watch for potential scalp opportunities. If the price breaks below 3057.273 and heads toward 3049.493, a short-term SELL trade may be triggered.
The price could move lower to test additional support levels below, providing an opportunity for scalp traders looking for quick profits.
Trade Execution Plan:
BUY Setup:
Entry: Wait for a price entry between 3083 and 3089, or any breakout above 3067.350.
Stop Loss: Place the stop at 3072, below the key support in the entry range.
Take Profit Target: Look to exit or monitor price action near 3096.384 (Imp Zone) for potential profit-taking.
SELL Setup (Scalp):
Entry: If the price breaks below 3057.273 and heads toward 3049.493, enter a short scalp position.
Take Profit: Watch for a retracement back to key support levels below the Imp Zone.
Overall Market Outlook:
Validity Time: 04 PM to 04 PM (4 April)
The bullish bias remains in play as long as the price holds above the support at 3056.885 and breaks the Important Zone around 3096.384. This could signify continuation toward higher levels.
On the other hand, if 3049.493 - 3057.273 (the scalp sell zone) holds, there may be short-term sell opportunities for traders looking to profit from quick market moves.
For the longer-term trend, the breakout above 3096.384 may indicate further upside potential toward higher targets, making XAUUSD a favorable buy setup for those monitoring these levels.
Charting Recommendations:
Monitor key price levels for potential breakouts or reversals.
Set alerts at 3067.350 for a bullish breakout, and 3057.273 for a possible bearish scalp trade.
Use volume and candlestick patterns to confirm breakouts or reversals.
Engaging Market Signals
Discover animated forex and crypto signals with real-time updates and vibrant, cartoon-inspired visuals.
Real-Time Charts
Experience dynamic 3D charts for XAU/USD, BTC, with engaging animations.


Animated Indicators
View lively buy/sell signals for each asset, making trading decisions fun and interactive.
Stay Updated
Follow the latest market news with a scrolling ticker featuring icons.


Address
Civi Lines, Khanewal, Punjab, Pakistan 58150